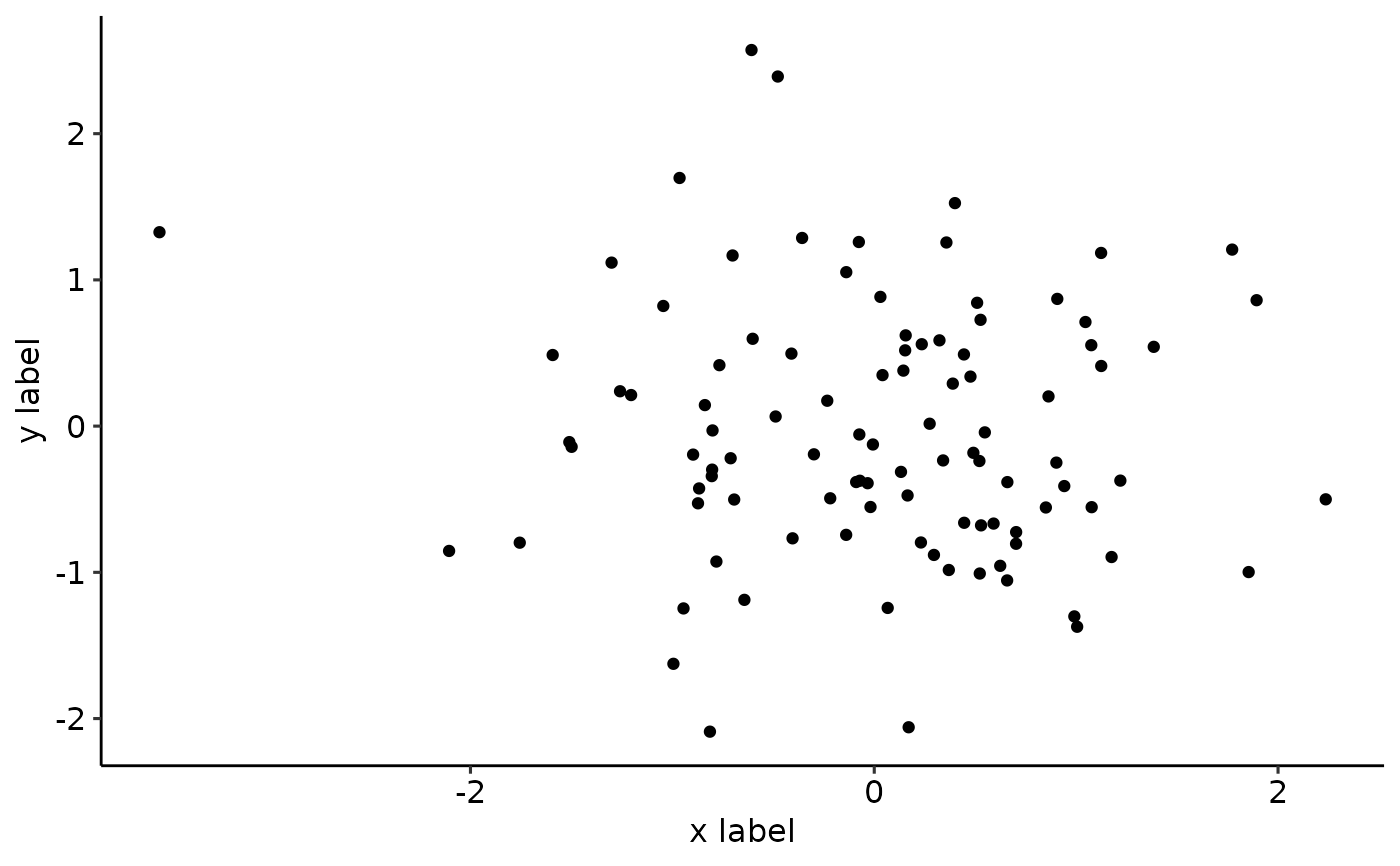
Create a basic plot using ggplot
basic_plot.RdThis function creates a basic plot with the help of ggplot.
basic_plot(
  df,
  x,
  y,
  color,
  xlab_setting,
  ylab_setting,
  ggplot_settings = ggplot_basic_settings(),
  legend_position = "none",
  scale_y = NULL
)
Arguments
- df
A data frame containing the data to be plotted.
- x
A string specifying the column name to be used as the x-axis variable.
- y
A string specifying the column name to be used as the y-axis variable.
- color
A string specifying the column name to be used as the fill variable.
- xlab_setting
ggplot labels settings for x axes.
- ylab_setting
ggplot labels settings for y axes.
- ggplot_settings
Additional settings for the ggplot.
- legend_position
A string specifying the position of the legend.
- scale_y
Optional ggplot2 scale function to modify the y axis.
Value
A ggplot plot.
Examples
df <- data.frame(x_var = rnorm(100),
                 y_var = rnorm(100),
                 color_var = sample(c("Red", "Blue"),
                 100,
                 replace = TRUE))
xlab_setting <- ggplot2::xlab("x label")
ylab_setting <- ggplot2::ylab("y label")
ggplot_instellingen <- ggplot2::geom_point()
scale_y <- ggplot2::scale_y_continuous()
basic_plot(df, "x_var", "y_var", "color_var", xlab_setting,
           ylab_setting, ggplot_instellingen, "none", scale_y)
