vvdoctor is an R package/Shiny app that provides a user-friendly interface for data analysis. It allows users to upload data files, visualize the data, perform statistical tests, and interpret the results.
The app is currently live on shinyapps.io, see: https://edulytics.shinyapps.io/vvdoctor/
Usage
## Install the app
devtools::install_github("vusaverse/vvdoctor")
library(vvdoctor)

## run the app
vvdoctor::run_vvdoctor()
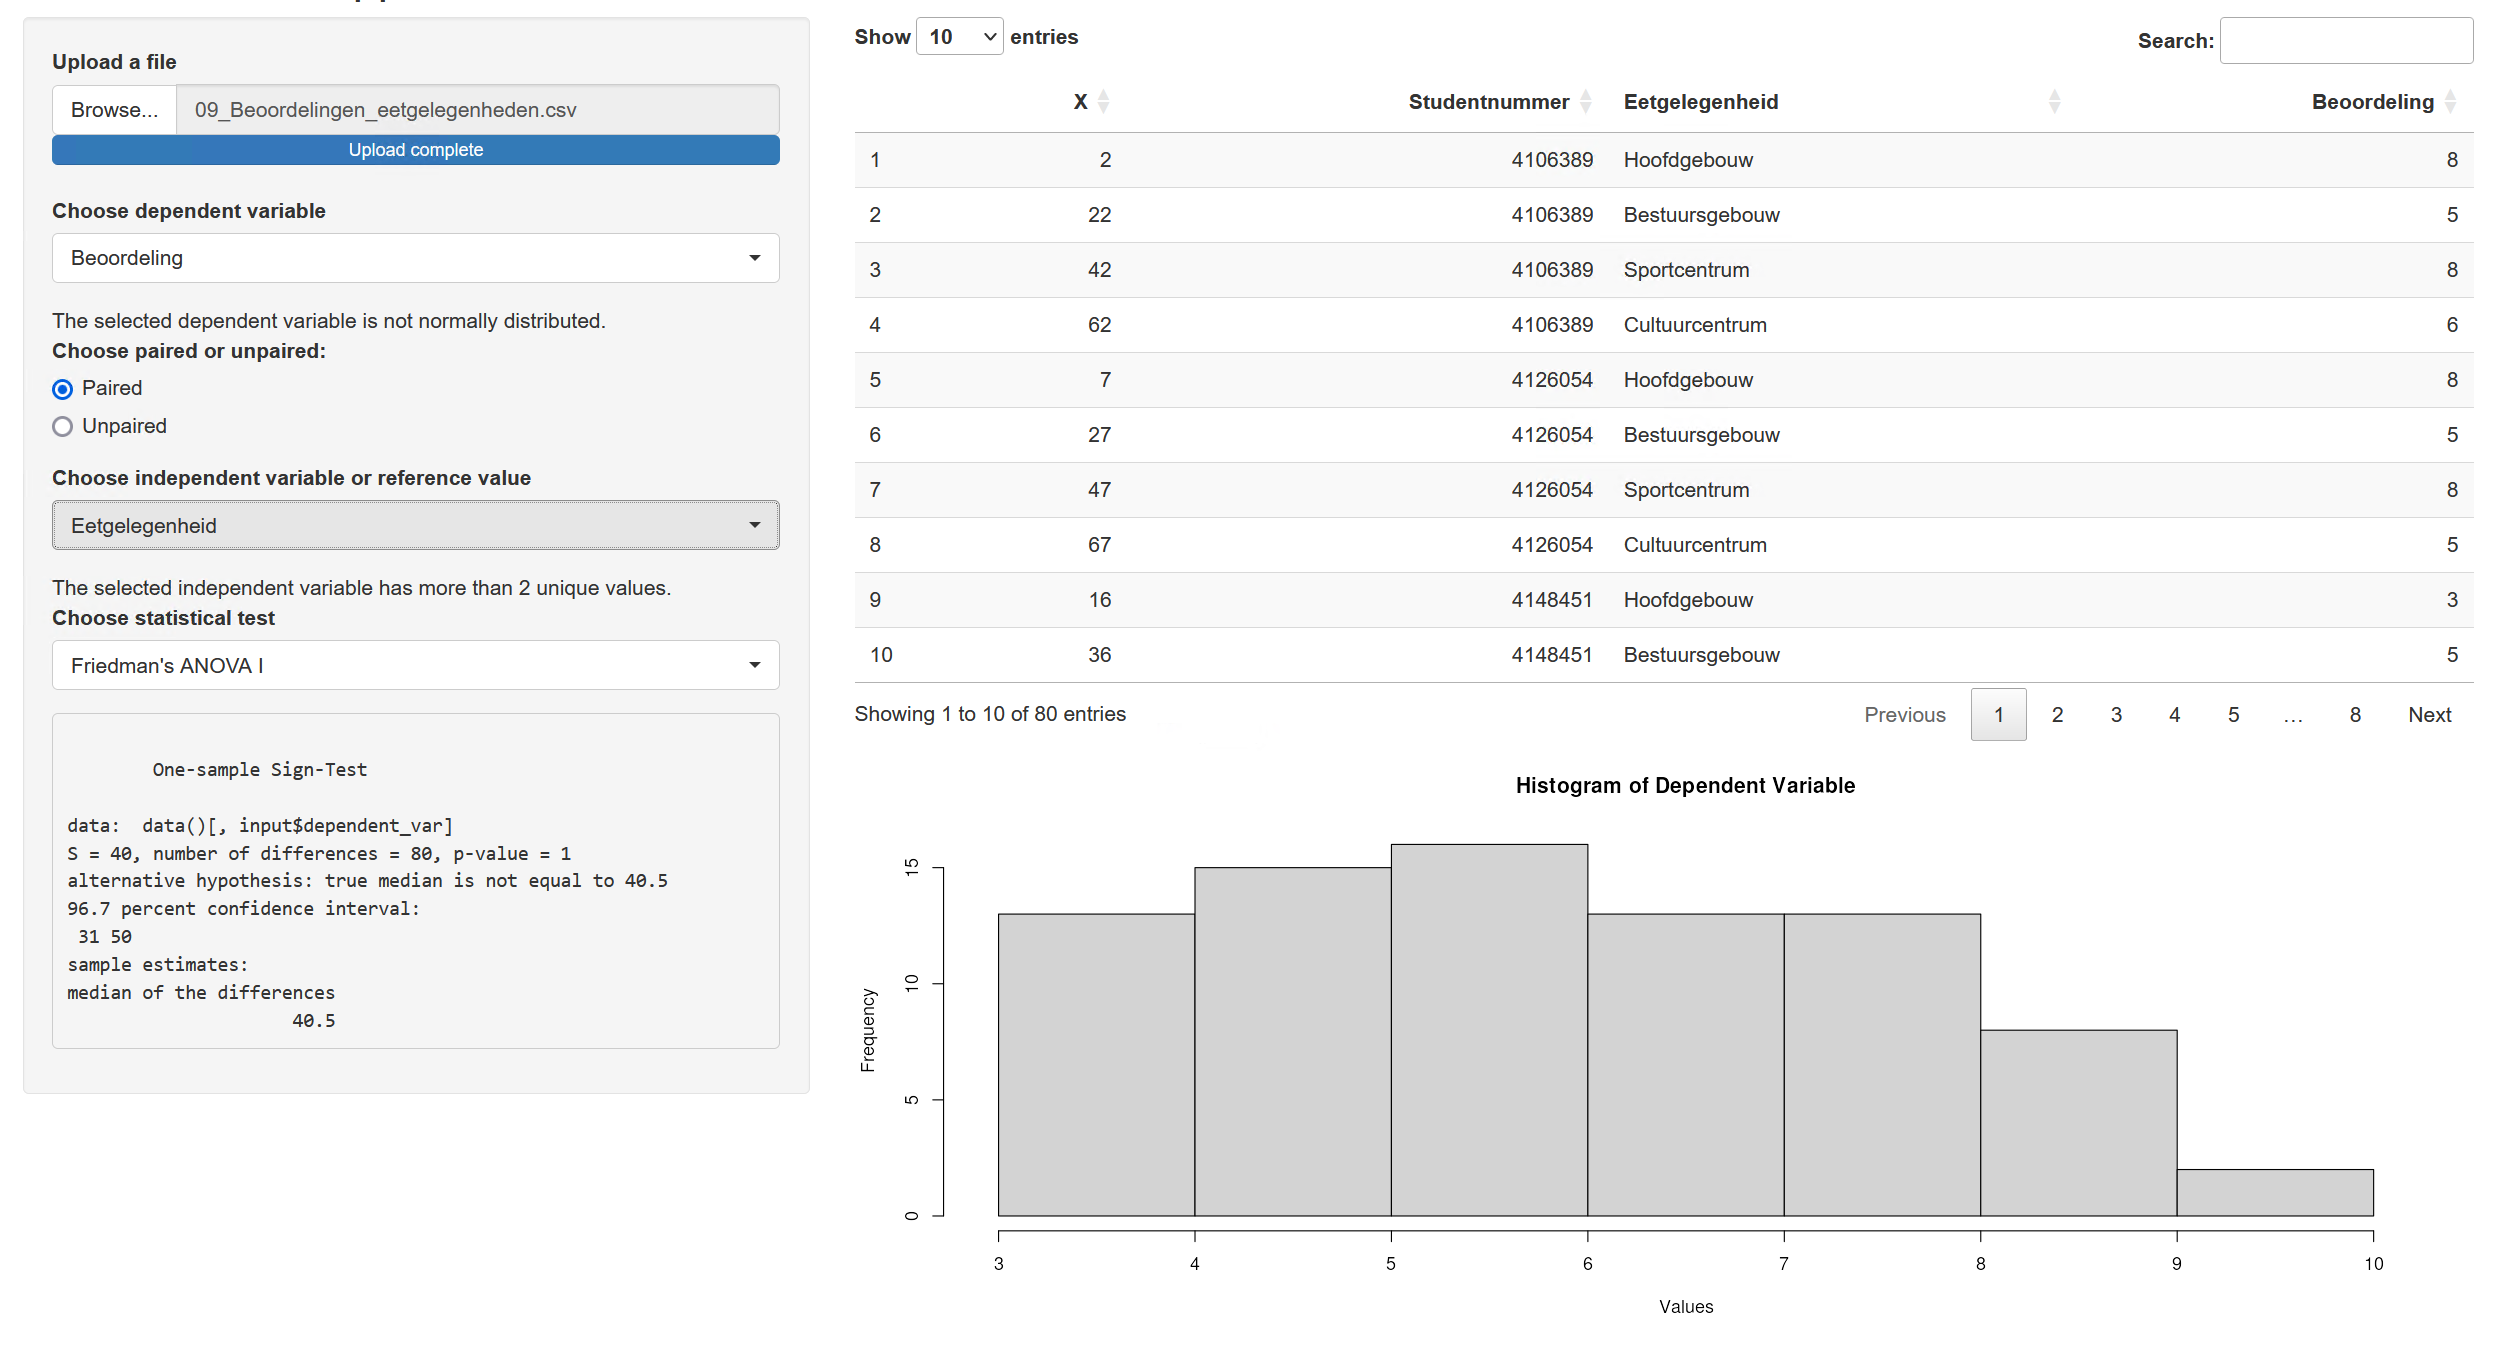
Uploading Data Files: Click on the “Browse” button to select and upload your data file in CSV or Excel format.
Displaying the Dataframe: Once the data file is uploaded, the app will display the data as a dataframe. You can explore the data by scrolling through the table or using the search and filter options.
Generating a Histogram: To generate a histogram of a specific variable, select a numeric dependent variable from the dropdown menu. The histogram will be displayed, allowing you to visualize the distribution of the data.
Choosing Dependent and Independent Variables: To perform statistical tests, select the dependent and independent variables from the respective dropdown menus. The available variables will be automatically populated based on the uploaded data.
Statistical Test Options: Once the variables are selected, the app will provide a list of statistical test options, such as t-tests, ANOVA, or correlation analysis. Choose the desired test and click on the “Run Test” button. The output of the test will be displayed, including the test statistic, p-value, and any additional relevant information.
Supported File Extensions
Currently, the following file types are supported:
| Full File Type Name | Full Extension Name | Package | Read Function | Parsable Arguments |
|---|---|---|---|---|
| R Data File | .RData | base | readRDS | None |
| ASCII Text File | .asc | utils | read.table | None |
| Comma Separated Values File | .csv | utils | read.csv | sep, header |
| Apache Feather File | .feather | feather | read_feather | None |
| Fixed-Size File | .fst | fst | read_fst | None |
| Apache Parquet File | .parquet | arrow | read_parquet | None |
| R Data File | .rda | base | readRDS | None |
| R Data File | .rds | base | readRDS | None |
| SPSS Data File | .sav | haven | read_sav | None |
| Tab Separated Values File | .tsv | utils | read.delim | sep, header |
| Text File | .txt | utils | read.delim | sep, header |
| Microsoft Excel File | .xlsx | readxl | read_excel | None |
Decision Tree for Statistical Test Selection
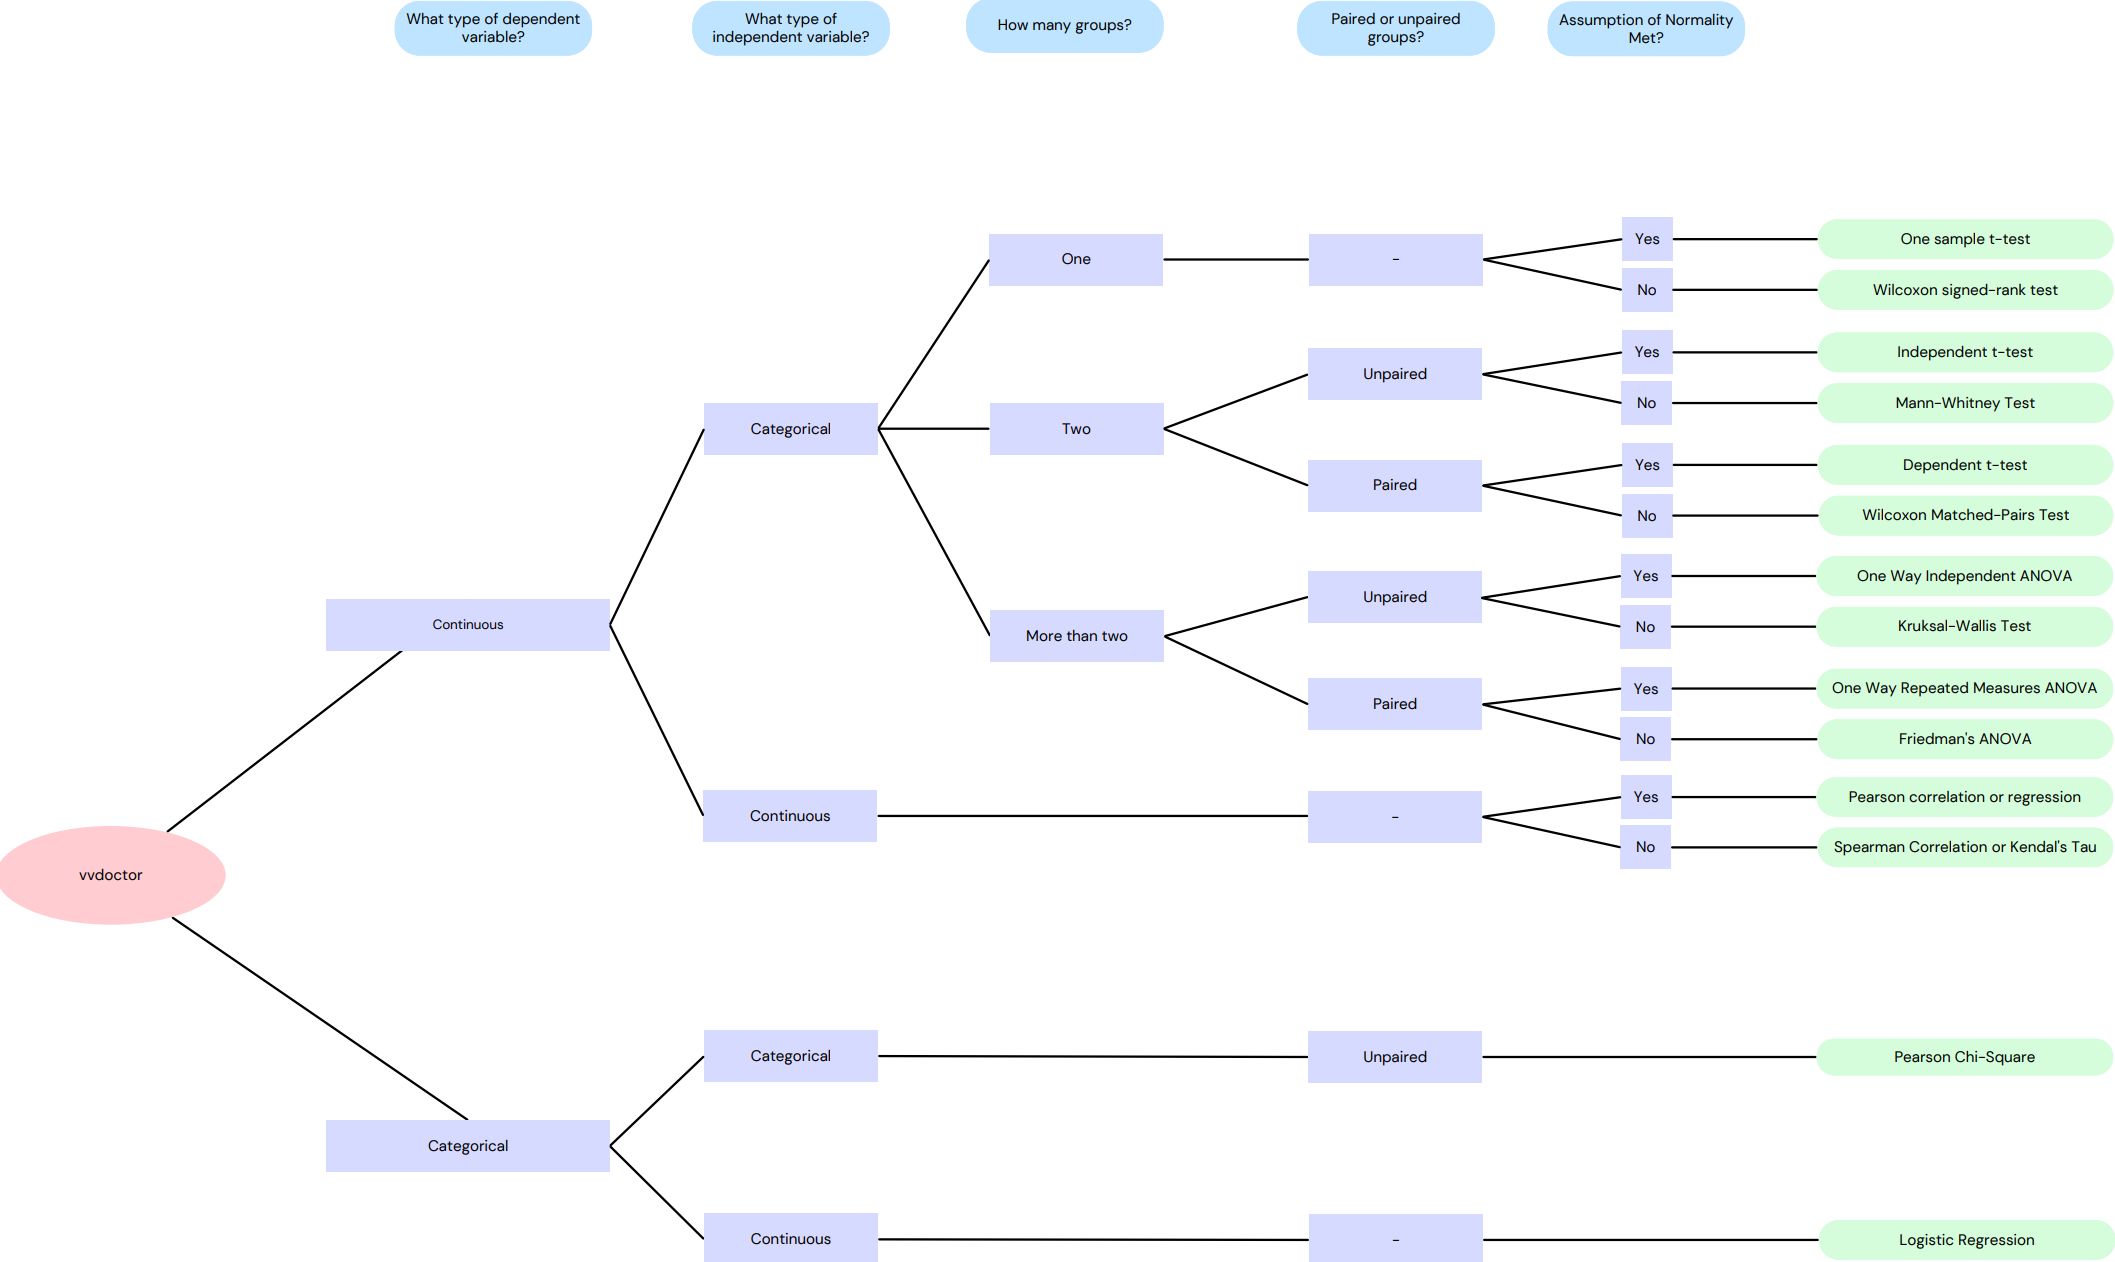
Based on the characteristics of the input data, the vvdoctor app uses the following decision tree to select the appropriate statistical test:

This flowchart illustrates the process of selecting a statistical test based on the class of independent/dependent variables, whether the test is paired or unpaired, and whether the data is normally distributed.
Overview of Implemented Statistical Test
The table below serves as a reference for understanding the logic behind the app’s functionality, showcasing how different statistical tests are executed through various R packages and functions.
| Statistical Test Name | R Package | R Function (from the package) |
|---|---|---|
| Sign Test | DescTools | SignTest() |
| Wilcoxon Signed Rank Test | stats | wilcox.test() |
| Mann-Whitney U Test | stats | wilcox.test() |
| Kruskal-Wallis Test | stats | kruskal.test() |
| One Sample t-test | stats | t.test() |
| Paired t-test | stats | t.test() |
| Independent Samples t-test | stats | t.test() |
| Repeated Measures ANOVA | ez | ezANOVA() |
| One-way ANOVA | stats | aov() |
| Chi-Square Goodness-of-Fit and Binomial Test | stats | chisq.test() |
| McNemar’s Test | exact2x2 | exact2x2() |
| Chi-Square Test for Independence and Fisher’s Exact Test | stats | chisq.test() |
| Bhapkar’s Test | irr | bhapkar() |


